Home sales in Metro Vancouver housing market continue to outpace long-term averages for this time of year. The latest SnapStats reports that residential property listings in Downtown Vancouver, Vancouver West, Vancouver East, North Vancouver and West Vancouver reached 4,789 on the Multiple Listing Service® (MLS®) in October 2014. This represents a 73% decrease compared to the 5,166 listings recorded in September. Last month’s sales were totalled 1,271 in October and the sales is 7% above September of 1,188.
Market in Downtown Vancouver
The total number of properties currently listed for sale on MLS® system in Downtown Vancouver is 792 and 283 homes were sold in October. The sale recorded in October is the highest in past 12 month. The number of listing properties has declined 8.1% compared to September 2014. The sales-to-inventory ratio currently sits at 35.73% average in the Sellers Market, which means 3.6 in 10 homes are selling. This states the 6.73% increased from 29% recorded in September.
The median sales price decreased 5% from September 2014 to $510,000. Homes are currently selling on the average of 3% below their listing price. The Most Active Price Range is in between $0 to $300,000 at 57% sales ratio as well as $1.5 million to $1.75 million at 53% sales ratio. The Sellers Best Bet is homes in Yaletown and up to 1 bedroom properties. The Buyers Best Bet is the following: Homes between $800,000 to $900,000; $5 million plus, Downtown and up to 1 bedrooms properties.
From the 13 Month Market Trend figure below, sales price in Downtown Vancouver has been increasing since July 2014, and we see a continual increase in October. The Buyers activity has been increasing accordingly.
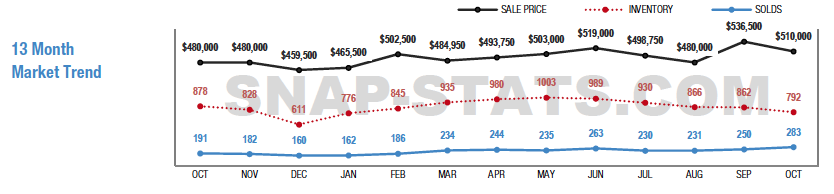
Source: SnapStats Metro Vancouver Edition October 2014, SnapStats Publishing Co.
Market in Vancouver West
Sales for both Detached and Attached properties in Vancouver West totalled 356 units out of 1,614 listings. This represents a 14.8% increase in sales from September 2014, and Detached and Attached properties in Westside have 22% average sales ratio. The Vancouver West Detached Market is facing Sellers Market at 22% sales ratio average. The Most Active Price Band in the Detached Market has increased to $1.5 to $1.75 million with 83% ratio and $2 to $2.5 million range with 50% sales ratio, and Attached Market active price band has remained at $0 to $300,000 range.
Market in Vancouver East
New listings in Vancouver East reached 1,026 units and sales are totalled 328 in October. Detached Market is facing Sellers Market with 41% sales ratio and the market is the most active at $800,000 to $900,000 with 78% sales ratio, which means 7.8 in 10 homes are sold. The Homes are sold at $995,000, and 0.80% decreased from last month. The inventory of the Attached Market in Vancouver East reached 628, and it is the second highest in past 12 month trend, and homes are selling on average 1% below listing price. The market is facing Sellers Market at 25% sales ratio, and the most active at $500,000 to $600,000 with 34% sales ratio.
Market in North Vancouver
Total properties listed in MLS® has become 789 units in North Vancouver in October, and 214 units were sold. The sales ratio has decreased to 28.79%, and this shows a 5.64% decrease compared to September 2014. The number of sold properties has been decreasing since April 2014 in North Vancouver Detached Market. The Most Active Price Range in October has remained at $700,000 to $800,000 with 96% sales ratio. The Attached Market has changed from the Balanced Market to the Sellers Market, and the sales ratio is at 24%.
Market in West Vancouver
Detached Market is Balanced Market now with 16% sales ratio, and the Attached Market has changed to Balanced Market with 20% sales ratio average in October. In Detached Market, the Most Active Price Band has shifted down to $1.5 million to $1.75 million band with 36% sales ratio, and homes are selling on average 7% below list price. The Buyers Market in West Vancouver was less active in October. The Attached Market has changed to Balanced Market, and the Most Active Price Range has shifted up to $1,000,000 to $1,250,000 with 45% sales ratio.
For More Information, Please Visit Our Office or Contact Us.
Leave a Reply