Condition within the Metro Vancouver housing market continued to strengthen in February as home sale and listing totals came in well above the region’s ten-year average for the month. The latest SnapStats reports that residential property listings in Downtown Vancouver, Vancouver West, Vancouver East, North Vancouver and West Vancouver reached 4,354 on the Multiple Listing Service® (MLS®) in February 2015. This represents a 18% increase compared to the 3,689 listings recorded in January. Last month’s sales were totalled 1,329 in February and the sales is 41.4% above January of 779.
Market in Downtown Vancouver
The total number of properties currently listed for sale on MLS® system in Downtown Vancouver is 707 and 248 homes were sold in February. The number of sales recorded in February is the second highest in past 6 month. The number of listing properties has increased 9.7% compared to January 2015. The sales-to-inventory ratio currently sits at 35.08 % average in the Sellers Market, which means 3.5 in 10 homes are selling. This states the 10.86% increased from 24.22% recorded in January.
The median sales price increased 2.43% from January 2015 to $505,500. Homes are currently selling on the average of 2% below their listing price. The Most Active Price Range is in between $300,000 to $400,000 at 48.98% sales ratio as well as $1 million to $1.25 million at 36.59% sales ratio. The Sellers Best Bet is homes in Westend, Yaletown and up to 2 bedroom properties. The Buyers Best Bet is the following: Homes between $900,000 to $1 million, Coal Harbor and minimum 3 bedrooms properties.
From the 13 Month Market Trend figure below, sales price in Downtown Vancouver has been increasing since December 2014, and we see continual rise in 2015.
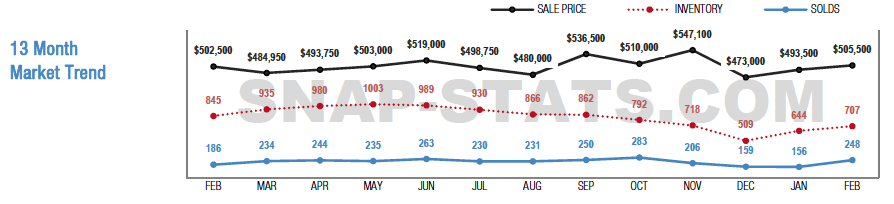
Source: SnapStats Metro Vancouver Edition February 2015, SnapStats Publishing Co.
Market in Vancouver West
Sales for both Detached and Attached properties in Vancouver West totalled 373 units out of 1,528 listings. This represents a 76% increase in sales from January 2015, and Detached and Attached properties in Westside have 24.5% average sales ratio. The Vancouver West Detached Market is facing Sellers Market at 23% sales ratio average. The Most Active Price Band in the Detached Market has increased to $1.75 to $2 million with 68% ratio and $2 to $2.25 million range with 68% sales ratio, and Attached Market active price band has increased at $1.5 to $1.75 million range.
Market in Vancouver East
New listings in Vancouver East reached 830 units and sales are totalled 305 in February. Detached Market is facing Sellers Market with 49% sales ratio and the market is the most active at $700,000 to $900,000 with 100% sales ratio, which means 10 in 10 homes are sold. The Homes are sold at $1,099,000, and the price is the highest in past 12 months. The inventory of the Attached Market in Vancouver East reached 536, and 161 homes were sold. Homes are selling on average at listing price. The market is facing Sellers Market at 30% sales ratio, and the most active at $700,000 to $800,000 with 59% sales ratio.
Market in North Vancouver
Total properties listed in MLS® has become 725 units in North Vancouver in February, and 261 units were sold. The sales ratio has increased to 49.19%, and this shows a 12.58% increase compared to January 2015. The sales price has been increasing since November 2014 in North Vancouver Detached Market, and it was the second highest in last month. The Most Active Price Range in February has increased at $900,000 to $1,000,000 with 100% sales ratio. The Attached Market has changed to the Balanced Market, and the sales ratio is at 29%.
Market in West Vancouver
West Vancouver Detached Market is Sellers Market now with 25% sales ratio, and the Attached Market has changed to Buyers Market with 24% sales ratio average in February. In Detached Market, the Most Active Price Band has increased to $1.5 million to $1.75 million band with 100% sales ratio, and homes are selling on average 2% below list price. The Market in West Vancouver is more active in February. In the Attached Market, the Most Active Price Range has remained the same at $900,000 to $1,000,000 with 24% sales ratio.
For More Information, Please Visit Our Office or Contact Us.
Leave a Reply