The market continues to be a competitive spring market for Metro Vancouver home buyers. This competition continues to put upward pressure on home prices, particularly in the detached home market. The latest SnapStats reports that residential property listings in Downtown Vancouver, Vancouver West, Vancouver East, North Vancouver and West Vancouver reached 4,366 on the Multiple Listing Service® (MLS®) in May 2015. This represents a 1.6% decrease compared to the 4,438 listings recorded in April. Last month’s sales were totalled 1,666 in May and the sales is 1% below April of 1,683.
Market in Downtown Vancouver
The total number of properties currently listed for sale on MLS® system in Downtown Vancouver is 734 and 280 homes were sold in May. The number of sales recorded in May is the highest in past 6 month. The number of listing properties has decreased 0.8% compared to April 2015. The sales-to-inventory ratio currently sits at 38.15% average in the Sellers Market, which means 3.8 in 10 homes are selling. This states the 0.59% increased from 38.74% recorded in April.
The median sales price increased 0.53% from April 2015 to $517,500. Homes are currently selling on the average of 1% below their listing price. The Most Active Price Range is in between $300,000 to $500,000 at 57% sales ratio as well as $2.75 million to $3 million at 36% sales ratio. The Sellers Best Bet is homes in Yaletown and up to 1 bedroom properties. The Buyers Best Bet is the following: Homes between $0 to $300,000; $5 million plus, Coal Harbor and minimum 4 bedrooms properties.
From the 13 Month Market Trend figure below, sales price in Downtown Vancouver has been increasing since December 2014, and we see continual rise in 2015.
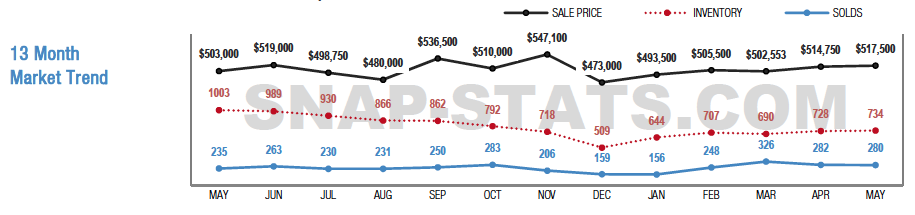
Source: SnapStats Metro Vancouver Edition May 2015, SnapStats Publishing Co.
Market in Vancouver West
Sales for both Detached and Attached properties in Vancouver West totalled 512 units out of 1,520 listings. This represents a 0% increase in sales from April 2015, and Detached and Attached properties in Westside have 33.52% average sales ratio. The Vancouver West Detached Market is facing Sellers Market at 32% sales ratio average. The Most Active Price Band in the Detached Market has increased to $1.5 to $1.75 million with 87% ratio and $2 to $2.25 million range with 82% sales ratio, and Attached Market active price band has increased at $400,000 to $500,000 range.
Market in Vancouver East
New listings in Vancouver East reached 836 units and sales are totalled 427 in May. Detached Market is facing Sellers Market with 57% sales ratio and the market is the most active at $900,000 to $1.25 million with 81% sales ratio, which means 8.1 in 10 homes are sold. The Homes are sold at $1,200,000, and the price is the highest in past 12 months. The inventory of the Attached Market in Vancouver East reached 479, and 223 homes were sold. Homes are selling on average at listing price. The market is facing Sellers Market at 47% sales ratio, and the most active at $600,000 to $700,000 with 100% sales ratio.
Market in North Vancouver
Total properties listed in MLS® has become 720 units in North Vancouver in May, and 316 units were sold. The sales ratio has decreased to 59.27%, and this shows a 10.37% decrease compared to April 2015. The sales price has been increasing since January 2015 in North Vancouver Detached Market, and it was the second highest in last 12 month. The Most Active Price Range in May has decreased at $800,000 to $900,000 with 84% sales ratio. The Attached Market has remained at the Sellers Market, and the sales ratio is at 36%.
Market in West Vancouver
West Vancouver Detached Market is Sellers Market now with 21% sales ratio, and the Attached Market has remained to Sellers Market with 33.33% sales ratio average in May. In Detached Market, the Most Active Price Band has increased to $2 million to $2.25 million band with 86% sales ratio, and homes are selling on average 4% below list price. In the Attached Market, the Most Active Price Range has increased to $1 million to $1.25 million with 67% sales ratio.
For More Information, Please Visit Our Office or Contact Us.
Leave a Reply