Metro Vancouver home sales were more than a third above the 10-year average in July, while the number of homes listed for sale continues to trend below recent years. The latest SnapStats reports that residential property listings in Downtown Vancouver, Vancouver West, Vancouver East, North Vancouver and West Vancouver reached 3,845 on the Multiple Listing Service® (MLS®) in July 2015. This represents a 5.2% decrease compared to the 4,057 listings recorded in June. Last month ‘s sales totalled 1,544, and the sales is 13.5% below the 1,784 sales of June.
Market in Downtown Vancouver
The total number of properties currently listed for sale on MLS® system in Downtown Vancouver is 615 and 336 homes were sold in July. The Sales Price recorded in July is the highest in past 12 month. The number of properties listed has decreased 8.9% compared to June 2015. The sales-to-inventory ratio currently sits at 47.33% average in the Sellers Market, which means 4.7 in 10 homes are selling. This states a 7.3% decreased from 54.63% recorded in June.
The median sales price decreased 0.53% from June 2015 to $565,000. Homes are currently selling on the average at their listing price. The Most Active Price Range is in between $600,000 to $700,000 at 86% sales ratio as well as $2.25 million to $2.5 million at 50% sales ratio. The Sellers Best Bet is homes in Westend and up to 2 bedroom properties. The Buyers Best Bet is the following: Homes between $0 to $300,000; $2.75 to $3 million, Coal Harbor and 2 bedrooms properties.
From the 13 Month Market Trend figure below, sales price in Downtown Vancouver has been increasing since December 2014, and we see continual rise in July 2015.
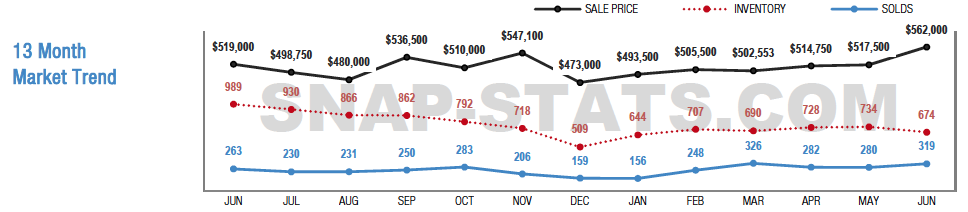
Source: SnapStats Metro Vancouver Edition July 2015, SnapStats Publishing Co.
Market in Vancouver West
Sales for both Detached and Attached properties in Vancouver West totalled 461 units out of 1,355 listings. This represents a 9.1% decrease in sales from July 2015, and Detached and Attached properties in Westside have 39.38% average sales ratio. The Vancouver West Detached Market is facing Sellers Market at 26% average sales ratio. The Most Active Price Band in the Detached Market has increased to $1.5 to $2 million with 73% ratio and $2 to $2.25 million range with 100% sales ratio, and Attached Market active price band has increased to $1.5 million to $1.75 million range.
Market in Vancouver East
New listings in Vancouver East reached 733 units and sale totalled 367 in July. Detached Market is facing Sellers Market with 43% sales ratio and the market is the most active at $800,000 to $1.5 million with 55% sales ratio, which means 5.5 in 10 homes are sold. The Homes are sold at $1,276,500, and the price is the highest in past 12 months. The inventory of the Attached Market in Vancouver East reached 418, and 219 homes were sold. Homes are selling on average 2% below list price. The market is facing Sellers Market at 52% sales ratio, and the most active at $800,000 to $900,000 with 100% sales ratio.
Market in North Vancouver
Total properties listed in MLS® has become 554 units in North Vancouver in July, and 280 units are sold. The sales ratio has increased to 61.05%, and this shows a 5.91% decrease compared to July 2015. The sales price has been increasing since January 2015 in North Vancouver Detached Market, and it was the second highest in last 12 month. The Most Active Price Range in July has increased at $1000,000 to $1.25 million with 100% sales ratio. The Attached Market has remained at the Sellers Market, and the sales ratio is at 45%.
Market in West Vancouver
West Vancouver Detached Market is Balanced Market now with 18% sales ratio, and the Attached Market has changed to Balanced Market with 19% sales ratio average in July. In Detached Market, the Most Active Price Band has increased to $2.5 million to $2.75 million band with 56% sales ratio, and homes are selling on average 4% below list price. In the Attached Market, the Most Active Price Range has increased to $900,000 to $1,000,000 with 27.27% sales ratio.
For More Information, Please Visit Our Office or Contact Us.
Leave a Reply